Study Design
The database consists of data from 20 healthy subjects.
Their characteristics are as follows: 5 females and 15 males, with an average age of 28 years, an average height of 175 cm and weight of 74 kg.
The shoe sizes were limited to the range of 38 to 44 due to
the available insole sizes.
Instrumentation
Data was acquired using five IMU sensors laterally attached to the left and right shoes as well as wrists and within the right pocket as shown below:
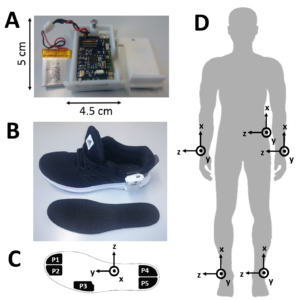 .
.
Data from 3D accelerometer and gyroscope were recorded and well as pressure data from Moticon insoles. The data was synchronised and labelled using the smart annotation tool.
Citation
Please cite this publication when using the data set:
[1] C. F. Martindale, N. Roth, J. Hannink, S. Sprager and B. M. Eskofier, “Smart Annotation Tool for Multi-sensor Gait-based Daily Activity Data,” 2018 IEEE International Conference on Pervasive Computing and Communications Workshops (PerCom Workshops), Athens, 2018, pp. 549-554.
doi: 10.1109/PERCOMW.2018.8480193
Smart Annotation Tool for Multi-sensor gait based daily activity data
In: 2018 IEEE International Conference on Pervasive Computing and Communications Workshops (PerCom Workshops) 2018
DOI: 10.1109/PERCOMW.2018.8480193
URL: https://www.mad.tf.fau.de/files/2018/09/percom2018_martindale.pdf
BibTeX: Download
Download
Download link currently not available, please contact the author
Data as csv files, please contact christine.f.martindale@fau.de in case of questions or urgent queries.
Included is a matlab code file to load and plot some example data.
The data is stored in columns with the following information:
imu_data_lf_1 refers to accelerometer in the X axis from the left foot sensor
imu_data_lf_2 refers to accelerometer in the Y axis from the left foot sensor
imu_data_lf_3 refers to accelerometer in the Z axis from the left foot sensor
imu_data_lf_4 refers to gyroscope in the X axis from the left foot sensor
imu_data_lf_5 refers to gyroscope in the Y axis from the left foot sensor
imu_data_lf_6 refers to gyroscope in the Z axis from the left foot sensor
The sensor positions are:
lf – left foot
rf – right foot
lw – left wrist
rw – right wrist
rp – right pocket
The pressure sensors and axis directions are numbered according to the diagram above.
Pressure sensor 1,2,3,4,5 are respecively outer toe, inner toe, inner heel, outer heel and midfoot.
The labels are separated into 5 columns: initial contact (heel strike) and terminal contact (toe off) per foot. Where a 1 represents the time point that the event occured.
The activity labels refer to the time point where the new activity began. The values represent the activiy as given in the text file given with the data.
Please note all activites include standing, pauses and mistakes.
There are three files per subject split into the three phases of the experiment as explained in the publication.
Acknowledgments
Bjoern Eskofier gratefully acknowledges the support of the German Research Foundation (DFG) within the framework of the Heisenberg professorship program (Grant Number ES 434/8-1).